


Debunking the Caricature: What Polygenic Scores Actually Show
A Data-Driven Examination of Polygenic Scores, Population Differences, and the Hereditarian Hypothesis

This article responds to criticisms raised by Gusev and others regarding the application of polygenic scores to study population differences in complex traits, particularly those found in Gusev’s blog and his discussion with Astral Codex Ten. Rather than engaging in polemics, I aim to provide a data-driven examination of the specific methodological and interpretive concerns that have been raised.
The first criticism: “People like Kirkegaard, Piffer, Lasker, etc. (and their boosters on social media like Steve Sailer and Cremieux) dedicated their careers to taking crappy GWAS data from and turning it into memes that show Africans on the bottom and Europeans on the top”.
This assertion is not supported by the evidence. If the primary motivation were to establish European genetic superiority, we would expect the data to consistently support this narrative. However, the empirical evidence presents a more complex picture that often contradicts such simplistic rankings.
In fact, African populations have some of the highest polygenic scores for height in the world, surpassing Europeans. West Africans score at or near the top for schizophrenia PGS (Curtis, 2018)—a finding replicated across multiple GWAS.
This myth persists because critics ignore the full body of evidence. When you actually look at the data—rather than caricatures of it—the story is far more nuanced than "Europeans always win."
The polygenic score distribution for extraversion shows:
Highest values in African populations (consistent across multiple studies)
Second-highest values among Middle Eastern groups (Arabs, Egyptians)
Intermediate values in Europeans
Lowest values in East Asian populations
This pattern matches common behavioral stereotypes for these regions.
Extraversion PGS, calculated using the latest personality GWAS (Schwaba et al., 2025):

The polygenic score distribution for height reveals several notable patterns:
Northern Europeans (Dutch and Scandinavian populations) show the highest height PGS values, corresponding with their documented status as the world's tallest populations.
West African populations (including Nigerians) demonstrate similarly elevated height PGS, despite not manifesting equivalent phenotypic heights. They have higher height PGS than several European populations.
This discordance likely reflects environmental constraints, as Nigerian height potential appears constrained by developmental factors (nutrition, disease burden) despite genetic predisposition (See our study)
East Asians, in particular the Japanese and Southeastern Asians (Vietnamese, Chinese Dai) have the lowest PGS, matching their shorter average stature.
Height PGS

Note that both polygenic scores have very high internal consistency (>0.75) as measured by the split-half reliability. Indeed, the covariance structure driving alignment between GWAS SNPs can be assessed via split-half reliability of polygenic scores (G = Σi βi pi), measured as Corr(GA, GB) for disjoint locus partitions A and B.
In other words, if alleles with similar effects on the traits have similar frequencies across populations, the split-half reliability of the polygenic scores will be higher. This can be used as an index of directional selection.
The Importance of Replication: How Polygenic Scores Withstood Scientific Scrutiny
The hallmark of credible science is replication—the ability of independent researchers to reproduce findings across different datasets and methodologies. The robust correlation (r ≈ 0.9) between educational attainment polygenic scores (EA PGS) and national IQ—first reported in Piffer (2013)—has been replicated several times, demonstrating its reliability beyond the original study.
1. Direct Replications by Piffer
Piffer (2015, Intelligence)
Expanded analysis to 23 global populations using a mix of IQ and Education GWAS available at the time.
Controlled for genetic stratification using Fst distances
Replicated the strong correlation (r = 0.9)
Piffer (2019, Psych)
Used updated GWAS (EA3) (Lee et al., 2018; N > 1M)
Confirmed results in 26 populations
Demonstrated cross-ancestry predictive validity
2. Replications by other researchers
Lasker et al. (2019, Psych)
EA PGS predicted g in both Whites and Blacks, though predictive power was weaker in the latter.
Replicated the 1.89 SD PGS gap between groups.
Fuerst et al. (2019)
Validated PGS differences across ancestry groups using the ABCD dataset, which is highly homogeneous—comprising American children of the same age, all assessed with the same test, genotyped using the same platform, and exclusively native English speakers..
Admixture regression showed African/Indigenous ancestry negatively predicted IQ, even after SES controls.
Replicated Piffer’s population-level PGS-IQ correlation, obtaining a correlation coefficient exactly of the same magnitude.

The original Piffer (2013) study used a rudimentary GWAS (only 3 genome-wide significant SNPs). Yet, as GWAS sample sizes grew from thousands to millions, subsequent replications:
Used far more sophisticated PGS (thousands of SNPs)
Applied stricter controls (stratification, SES, admixture)
Still found the same core pattern
Selective Criticism and the Qeios Non-Issue
“Gusev later says he’s specifically referring to figures like this one from Davide Piffer (from here; note that although the article looks nice and says “peer-approved” at the top, Qeios is not a real journal in the usual sense)”
"Qeios Isn't a Real Journal!" – A Distraction From the Data
Critics make a show of dismissing a Qeios-published paper, as if the platform’s unconventional model invalidates the findings. But this is a deliberate diversion because the same results appear in:
Piffer (2015, Intelligence) – Peer-reviewed, established journal
Piffer (2019, Psych) – Peer-reviewed, mainstream outlet
Piffer (2021, OpenPsych) – Open peer-review, open-access
The selective focus on a single Qeios paper is odd because the same findings exist across multiple journals. This approach prioritizes attacking the journal over engaging with the actual data, which sidesteps the substantive discussion entirely.
If the critics were serious, they’d address the substance—not the hosting platform.
The Population Structure Straw Man: Why Gusev's Critique Misses the Mark
The Claim:
“Polygenic scores will mistake social factors correlated with genetic factors as genetic. For example, in a society where black people have lower IQ because of racism and poor access to schooling, people with a certain gene (the gene for black skin) will have lower IQ. Therefore, a study that blindly correlates genes with IQ will incorrectly assume that the gene for black skin is a gene for IQ/etc. This will ironically seem to justify the original inequality (it will look like black people “only” have low IQ for genetic reasons). This is by far the biggest problem with a plot like this one, and the one Gusev’s post above talks about - and the post offers a good example of a real result on height which encountered this exact problem.”
This is a valid theoretical concern—but it does not apply to how modern GWAS for cognitive traits are conducted.
The population structure confounding scenario requires two critical conditions to be met:
Substantial population structure within the study sample (e.g., samples containing mixed European/African ancestry with significant admixture)
Systematic environmental disparities correlated with ancestry (e.g., discrimination affecting educational or cognitive outcomes based on ancestral background)
Current GWAS methodology for cognitive traits addresses these concerns through several design features:
Sample composition: Most cognitive ability and educational attainment GWAS employ samples with >99% European ancestry, substantially reducing the potential for large-scale population structure effects.
Statistical controls: Principal component analysis (PCA) and other covariate adjustment methods are routinely applied to control for any remaining population stratification.
These design choices have several implications for the population structure concern:
Reduced ancestry-based variation: In largely European samples, variants associated with major continental ancestry differences (such as those affecting skin pigmentation) show minimal frequency variation.
Limited environmental stratification: Within relatively homogeneous European populations, systematic discrimination based on fine-scale ancestry differences is less likely to occur at scales that would substantially confound GWAS results.
Controlled remaining structure: Any residual population structure (such as North-South European gradients) is explicitly modeled and controlled for in the analysis.
Supporting evidence for the robustness of these approaches comes from admixture regression studies. Research by Lasker et al. (2019) found that phenotypic markers of ancestry (including skin, hair, and eye color) did not mediate the relationship between genetic ancestry and cognitive measures, suggesting that appearance-based discrimination does not significantly account for observed genetic correlations.
“…and the post offers a good example of a real result on height which encountered this exact problem”
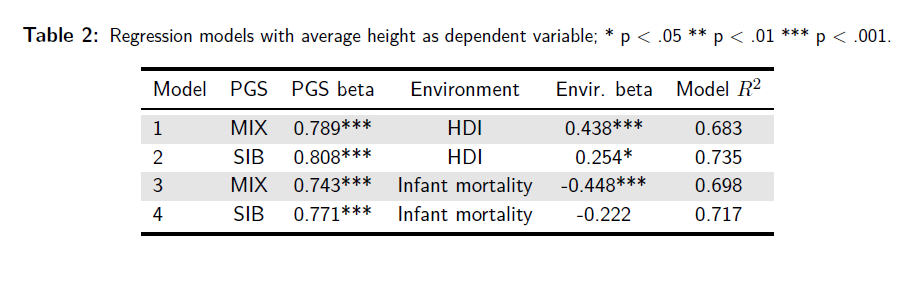
Gusev cites an outdated height GWAS where population structure inflated estimates. A study I co-authored with Kirkegaard (Piffer & Kirkegaard, 2024a), using a recent GWAS by Yengo et al. (2022) based on 5 million people and a sibship GWAS (Howe et al., 2022), shows that PGS predicts height across two global samples of 52 and 89 ethnic groups, even after adjusting for HDI/nutrition (protein and calorie intake). To be sure, human development and nutrition had almost as big an impact on stature as the polygenic scores, but the latter still explained a large part of the population differences in height, with standardized betas >0.5 in the whole-genome sequencing (WGS) sample:

The results were robusts to models that controlled for genetic autocorrelation:

The effect size was somewhat reduced (from 0.5 to 0.4) but still highly significant. On the other hand, the spatial autocorrelation term was significant only in about half of the models.
Testing European PGS on other ancestries
If polygenic scores were mere artifacts of European population structure, they should fail when applied to:
A different ancestry group (East Asians)
A different environmental context (China’s regional disparities)
Yet, the opposite happens.
The China Validation
Our study demonstrated (Piffer & Kirkegaard, 2024b) that polygenic scores for both IQ and height, derived from European GWAS, predict the average measured height and IQ differences across Chinese provinces.
IQ PGS:

Height PGSs:
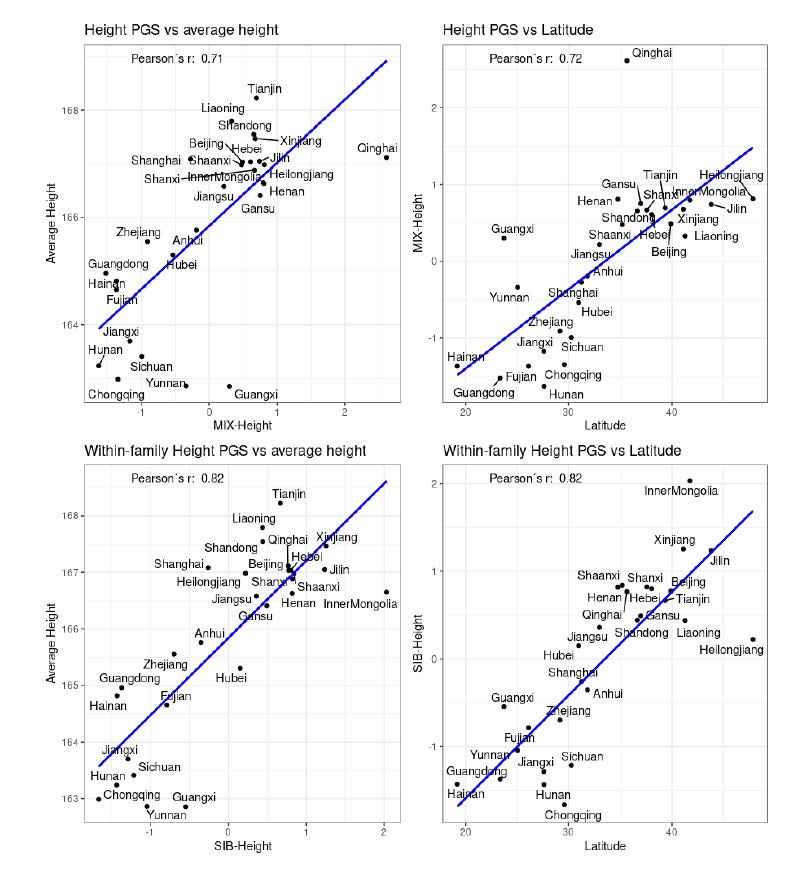
Here's an important point about Polygenic Scores (PGS) and ancestry bias in IQ prediction: If PGS were inherently biased by ancestry, we'd expect an East Asian model (genetically closer to Chinese populations) to outperform a European one for predicting IQ in China. But the opposite happens. Why? Because it's trained on vastly larger sample sizes, giving it statistical power.
Height PGS tells a different story. It actually works across ancestries within China. We see people in northern provinces have both higher height PGS and taller stature than those in the south – mirroring known historical genetic patterns.
Even after rigorously adjusting for major factors like HDI, nutrition, and infant mortality, the genetic signal for height stays dominant (β ≈ 0.8), significantly stronger than the environmental contributions (β ≈ 0.2–0.4).
For Chinese provinces IQ, environmental factors seem to act as mediators, but the direct effect of PGS was statistically significant:

For height, both PGS and environment mattered, although genetics plays a bigger role:
An East Asian-derived educational attainment polygenic score (EAS-EAS PGS) shows substantially lower correlation with cognitive ability among Chinese provinces (r = 0.21) than its European counterpart (r = 0.52). This divergence challenges the notion of inherent European ancestry bias in PGS construction. If such bias were the primary limitation, the genetically closer East Asian PGS should outperform the European model—yet the opposite holds true. The results instead demonstrate that predictive validity hinges critically on GWAS sample size rather than genetic similarity alone, as the European PGS leverages much larger training datasets to achieve superior statistical power and biological resolution.
Linkage Disequilibrium (LD) Decay
The Theoretical Concern
Gusev wrote: “Different groups could have the same intelligence genes, but in different linkage disequilibrium. That is, suppose Gene X and Gene Y are so close on the genome that they’re practically always inherited together. Scientists can’t isolate the effect of either, and they might only have one in their panel. Let’s say Gene X is in the panel, and Gene Y is an “intelligence gene”. Then the panel would show that Gene X is an intelligence gene. That’s fine as far as it goes - a score produced with that panel would still predict intelligence correctly. But if you apply it to a genetically different group, the assumption that Gene X and Gene Y always travel together might no longer hold. Then you might notice that black people lack Gene X, and incorrectly conclude that they lack an intelligence gene”.
In other words:
"If Gene X (tagged in GWAS) and Gene Y (true causal variant) are in LD in Europeans but not in Africans, PGS will give false results across populations."
This is mathematically correct in theory—but it must be tested empirically, which Gusev did not bother doing. Here's why:
My 2023 study (Piffer, 2023) quantified this by measuring Cross-Population LD Conservation. The average values were a bit higher for EUR-EAS (Mean r ∼ 0.75) than EUR-AFR (Mean r ∼ 0.59) pairs, due to the smaller genetic diversity.
Then I tested how LD Decay affects PGS differences and I found negative correlations between LD decay and genetic value differences, that is, poorly conserved SNPs (low R²) showed larger group differences for EA4 and Height but not EA3 and Schizophrenia:

The findings were:
East Asian-European EA4 differences nearly vanished (East Asians > Europeans after correction), and the EUR-AFR difference was reduced from 10 to 2.2 SDs
EUR-EAS Height gap reduced by 71%
Schizophrenia and EA3 differences remained stable
The Fatal Flaw in the Critique
The claim that "LD differences make PGS invalid" ignores that:
We can measure and correct for LD decay
Some traits (EA3, SCZ) show no LD-related bias at all

However, this approach has a trade-off: by restricting the GWAS to variants with low trans-ethnic LD differences, we reduce bias at the cost of statistical power due to a smaller set of variants.
Debunking the "Different Genetic Routes to Intelligence" Myth: Why It Collapses Under Scrutiny
The core claim critics make sounds deceptively simple: "Maybe Europeans and Africans evolved completely different sets of intelligence genes, rendering European-derived polygenic scores (PGS) useless for African populations." While this might seem plausible on the surface, it is not supported by the empirical evidence. In fact:
Polygenic traits rely on Shared Genetic Architecture. A decade of research confirm that the vast majority of genetic variants influencing complex traits like intelligence are common across human populations. This shared architecture stems from our common descent – modern humans inherited the genetic foundations for complex brains from ancestors long before populations diverged. Genome-wide association studies (GWAS) detect these shared causal variants, identifying alleles with both positive and negative effects on cognitive traits across ancestries. In technical jargon, selection acted on standing variation—the pool of genetic variants that already existed in ancestral populations before geographic separation occurred. Rather than creating new mutations, evolutionary pressures simply shifted the frequencies of these pre-existing alleles in different directions across populations. Some variants became more common in certain groups while others became less frequent, but the underlying genetic toolkit remained fundamentally the same. This process explains why the same genetic variants influence intelligence across human populations, even though they may exist at different frequencies, and why population differences in complex traits can emerge without requiring population-specific genetic innovations.
While population-specific variants do exist, they are relatively rare and their effects are much smaller than those of the shared variants that dominate the genetic architecture of complex traits. Identifying these population-specific variants would require conducting comprehensive GWAS across all major ancestral groups to detect the subtle, localized genetic contributions that emerged after population divergence.
Empirical Evidence Shows High Cross-Ancestry Correlations. The data rejects the idea of fundamentally divergent genetic paths:
Educational Attainment (EA): The genetic correlation (ρg) between European and East Asian populations is remarkably high at ~0.87 (Chen et al., 2024).
Schizophrenia Risk: Effects of common risk variants are near-identical between East Asians and Europeans (ρg = 0.98 ± 0.03; Lam et al., 2019).
Consistency Within Admixed Individuals: Even zooming in on individuals of mixed African-European ancestry, the effects of true causal alleles on cognitive traits show a correlation of 0.95 across local ancestry segments (Hou et al., 2023).
Broad Trait Pattern: While medical traits can show more variation (e.g., ρg from 0.53 to 0.98 in Zhang et al., 2023), cognitive traits consistently demonstrate high cross-population genetic similarity.
2. The "Dumb Gene" Thought Experiment: Exposing the Flaw in the Critique
Let's rigorously test the critics' core assumption using a simple thought experiment. Suppose a specific genetic variant exists – let's call it a "dumb gene" – that genuinely reduces IQ. In a Genome-Wide Association Study (GWAS), this variant would rightly receive a negative beta (β) weight, penalizing the polygenic score (PGS) of individuals carrying it.
Now, consider how this "dumb gene" behaves across populations under the critics' logic:
If the "dumb gene" is common in Europeans: The European GWAS will detect it and assign it a negative weight. Europeans' PGS will be penalized accordingly.
If the "dumb gene" is rare in Africans: Africans simply wouldn't carry this variant much. Therefore, the European-derived PGS (which includes the penalty for this gene) wouldn't unfairly penalize African scores, since the gene is mostly absent in Africa.
If the "dumb gene" is common in Africans: Crucially, the European GWAS would still detect it (if present in the training data) and assign it a negative weight. When applied to Africans, the PGS would penalize them for carrying this detrimental variant – correctly reflecting its harmful effect on intelligence.
This exposes the critical flaw in the critics' position: They wrongly assume a European GWAS only identifies alleles that benefit Europeans specifically. In reality, GWAS captures both detrimental and beneficial variants.
If Africans truly possessed many unique "dumb genes" (variants not captured by the European GWAS), the European-derived PGS applied to Africans would lack the negative weights for those specific detrimental variants. This would cause the PGS to overestimate African IQ, not underestimate it. Yet, critics claim the opposite – that European PGS underestimates non-European IQ due to "missing" variants.
The Spatial Autocorrelation Smokescreen: How Rigorous Methods Debunk a Lazy Critique
The "Three Clusters" Canard
Critics dismiss global PGS patterns as mere artifacts of African, European and East Asian genetic clusters.
This simplistic model ignores both:
Continuous genetic gradients (Fst spans 0.01-0.15, not discrete jumps)
Decades of methodological refinement to address spatial confounding
How We Test for Autocorrelation
Since 2015 (Piffer, 2015), my work has implemented methods that go far beyond basic Mantel tests:
Fst-Weighted Spatial Models
Replace geographic distance with genetic distance matrices
Explicitly model ancestry gradients rather than assume clusters
Multi-Layered Controls
Genetic neighbor effects (lag terms)
Spatial error structures
Environmental covariates (HDI, nutrition)
In my 2015 paper (Piffer, 2015), after unwittingly rediscovering Mantel’s test, I developed a novel adaptation specifically to address this issue, replacing geographical distances with FST genetic distances and phenotypic differences with polygenic score differentials. This method—apparently the first to use FST and polygenic scores in this context—explicitly tested whether PGS-IQ correlations persisted after accounting for shared ancestry. The robust findings demonstrated that polygenic score differences predicted cognitive variation independently of neutral genetic distances, implying selective pressures rather than population structure artifacts.
Robust Genetic Signals Persist Under Stringent Spatial Controls: Debunking the "Cluster" Artifact Hypothesis
In our latest height genetics research (Piffer & Kirkegaard, 2024a), we addressed concerns about spatial autocorrelation, deploying spatial genetic modeling techniques. Moving beyond simplistic controls, our multi-layered analysis incorporated:
Genetic neighborhood effects (defined by precise FST thresholds),
Complex spatial error structures, and
Simultaneous adjustment for key environmental confounders (including HDI and other socioeconomic/nutritional factors).
The results were robust across all model specifications:
Polygenic scores (PGS) remained a powerful predictor of height, retaining high statistical significance (β ≈ 0.40, p < 0.01).
Effect sizes demonstrated remarkable stability, showing only modest attenuation from the baseline model (β ≈ 0.50 → 0.40) despite the rigorous controls.
Environmental factors maintained independent predictive power, confirming a multifactorial model.
The most critical finding directly counters critics' main assumption: Spatial autocorrelation terms reached statistical significance in only 50% of our models. This empirical result contradicts the oversimplified "three continental clusters" hypothesis often invoked to dismiss PGS findings as mere artifacts of population structure.
Large PGS differences between genetically very similar populations
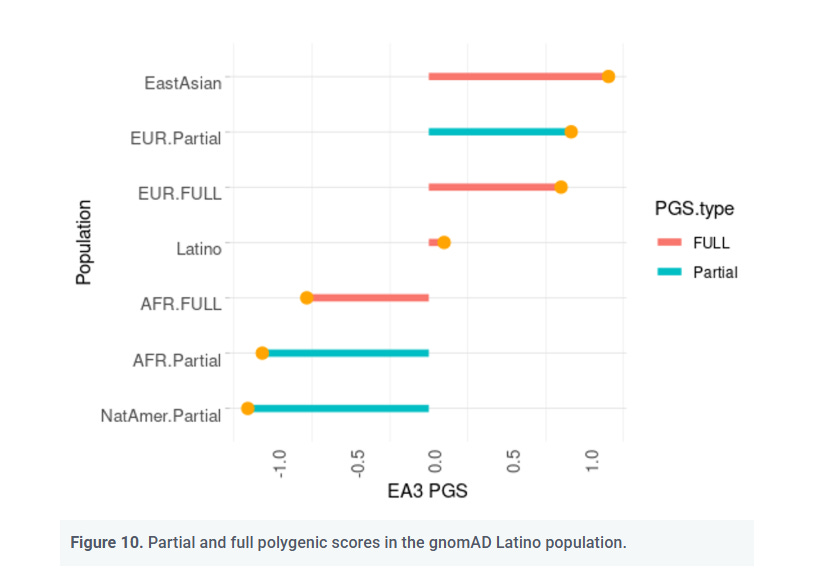
The Amerindian Anomaly
If PGS simply tracked neutral genetic distance:
Amerindians should have PGS similar to East Asians, due their overall genetic similarity
Instead, their EA3 PGS is more similar to that of Africans (Piffer, 2023), a very genetically distant group, as one can see from the lollipop chart shown below:
The Jewish Anomaly
In a study based on the Wisconsin Longitudinal Study (WLS), Dunkel et al. (2019), Ashkenazi Jews’ EA PGS was significantly higher than that of White Christians, amounting to Cohen’d= 1.33, which is a very large effect size. A limitation of this study was that there were only 53 Jews in the sample. However, similar results were obtained by Piffer (2019) using the Jews in gnomAD, which at the time included 145 individuals. On top of that, the correlation between the estimated IQ of the gnomAD populations and the EA PGS was 0.98:
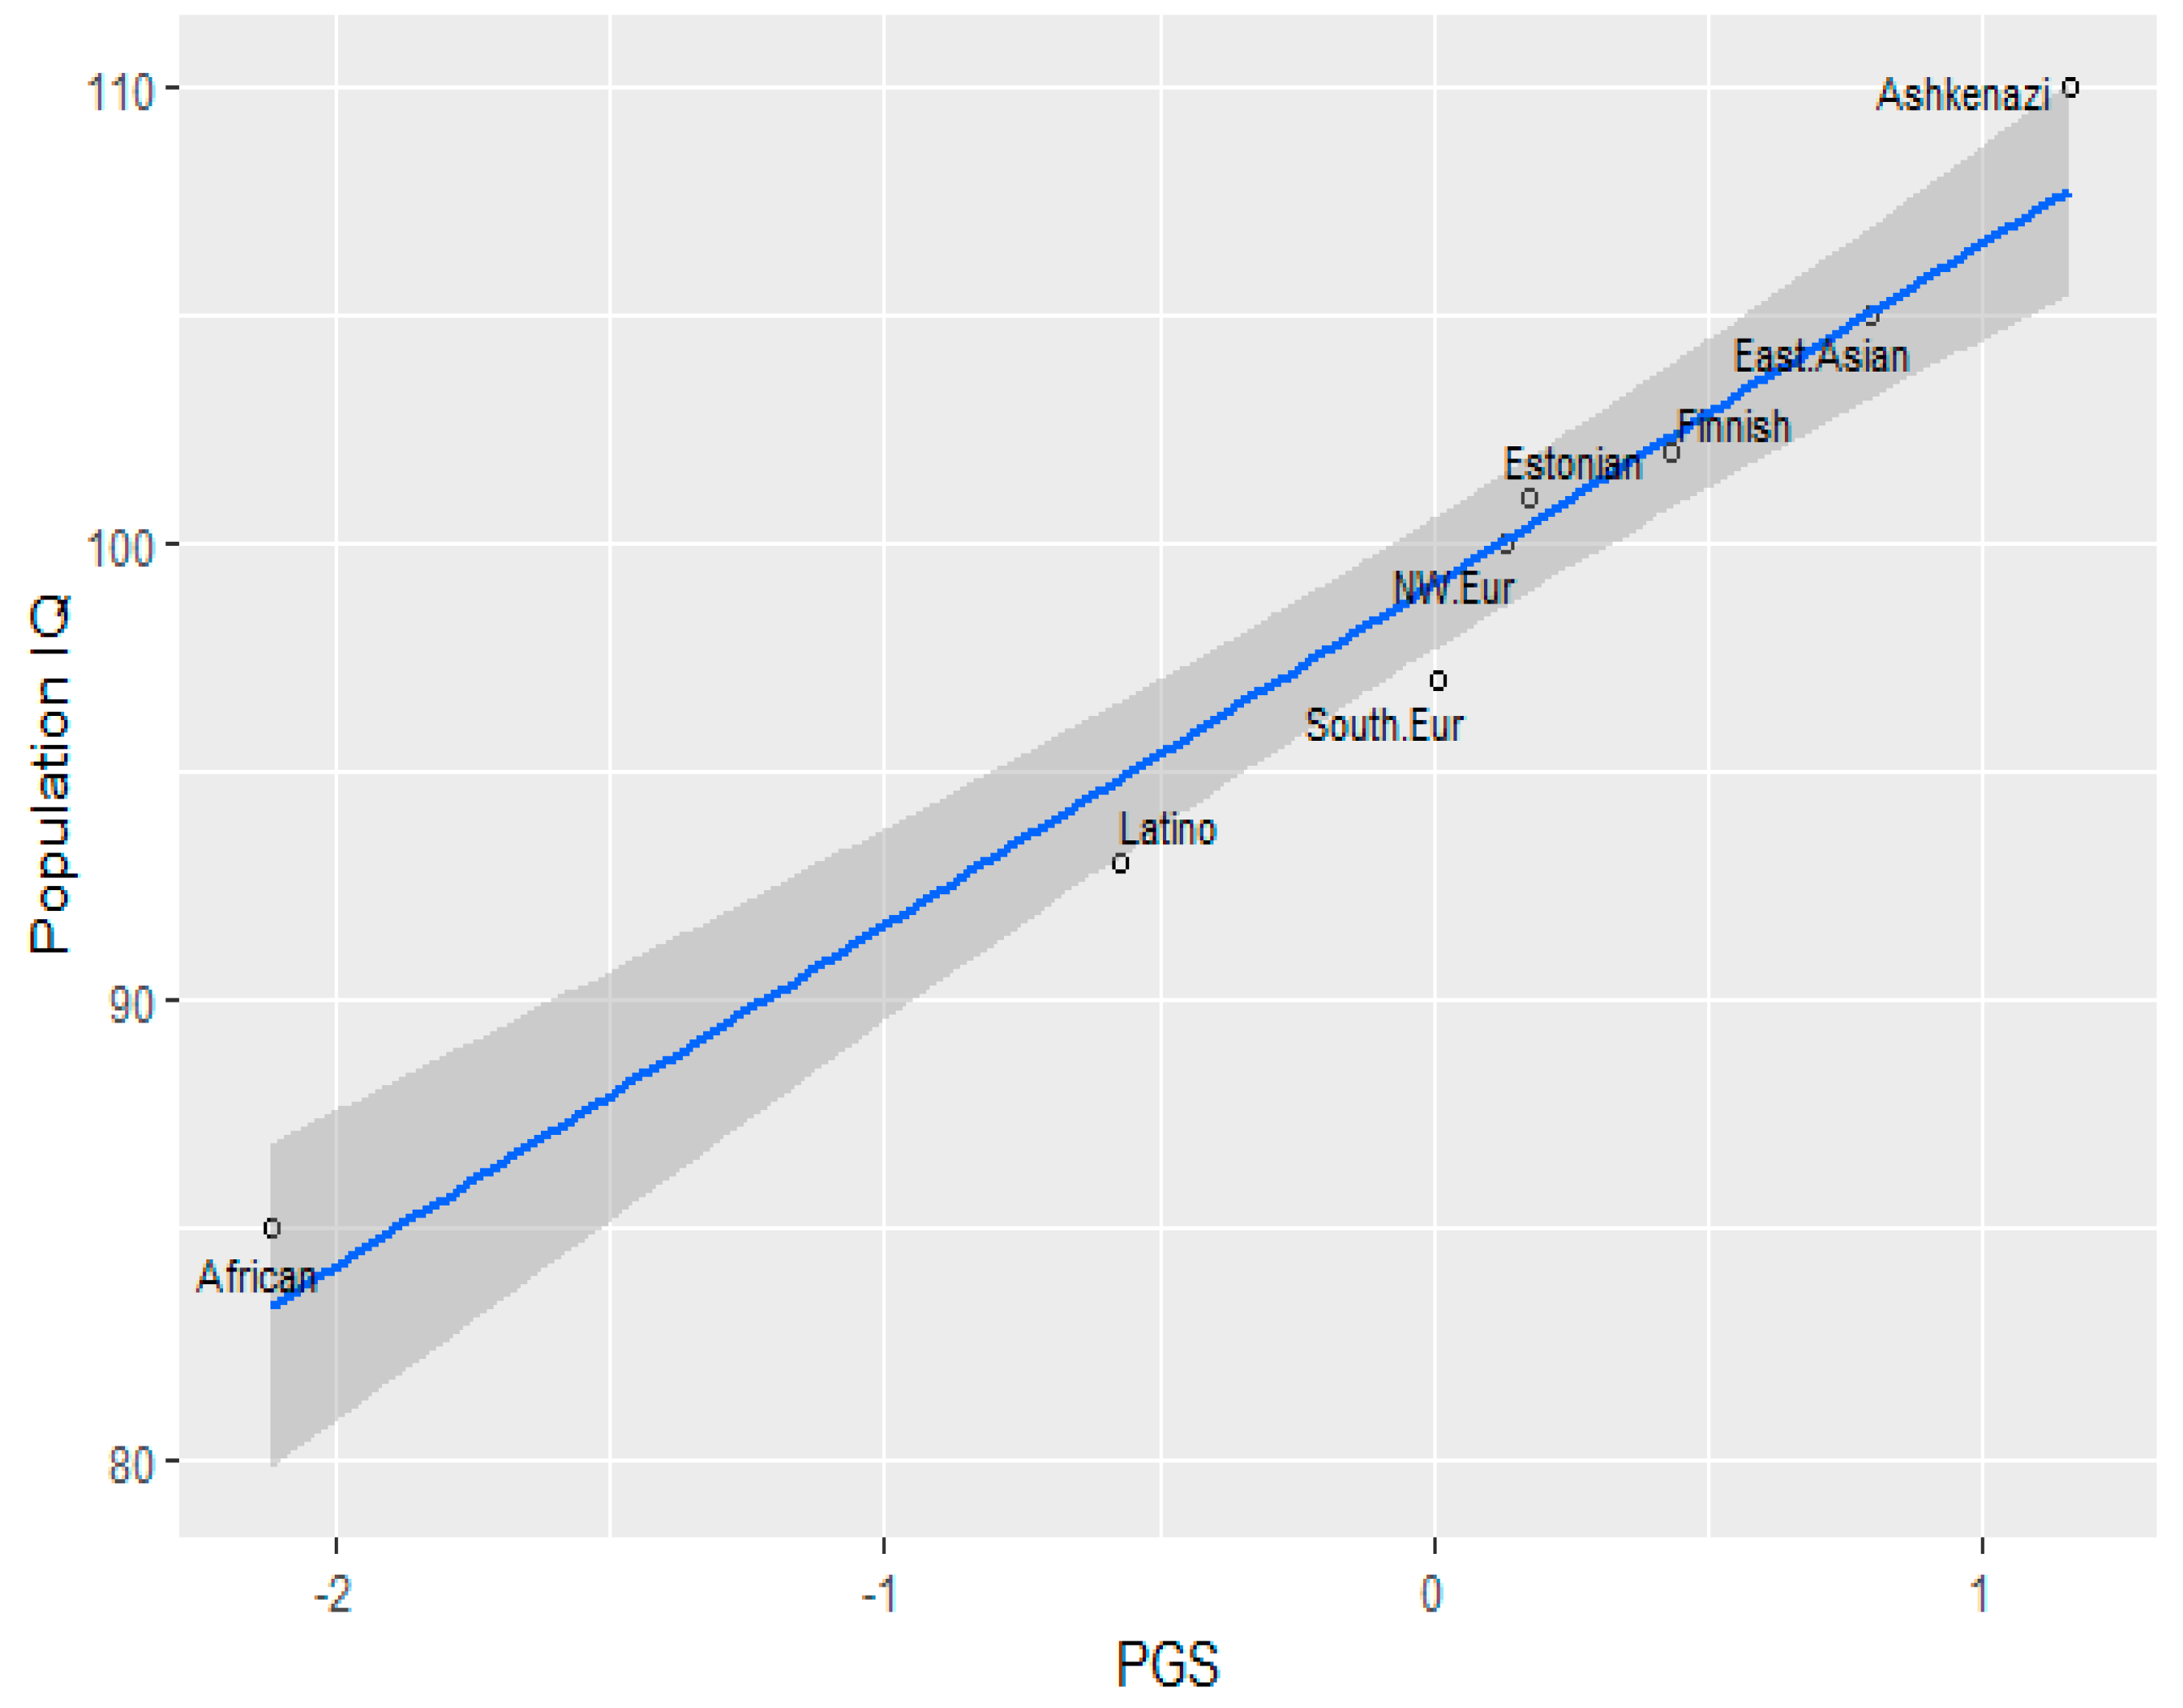
Crucially, an ancestry-based model fails to explain this result, because Ashkenazi Jews can be modelled as being about 50% Southern European and 50% Middle Eastern, yet their EA PGS is higher than both groups.
Dunkel et al. (2019) and Piffer (2019) used EA3. Did the results replicate with EA4? We know EA4 has portability issues, exaggerating the Black-White gap and putting Europeans above East Asians, especially without controlling for LD (Piffer, 2023). So let’s check how Ashkenazi Jews fare with EA4, using gnomAD v3.1.2, which has a much larger sample of Ashkenazi Jews (over 1,700) than gnomAD v2.1.1:

So, the Ashkenazi-European gap replicates even using EA4 with a much larger sample. The Amish score even higher than Ashkenazi Jews, which is odd, but lacking measured IQ for Amish samples, we cannot verify if this is a genuine genetic advantage or due to a bias in EA4.
The Italian Anomaly
Along similar lines, North and South Italians are genetically quite similar, yet there is a persistent gap in economic and educational achievement. Piffer & Lynn (2022) found a gap corresponding to Cohen’s d ~ 0.6 between Northern and Southern Italians in EA PGS, of the same magnitude as the gap in standardized test scores.
The Qst-Fst Test: More Evidence for Selection
Another line of evidence supporting the hereditarian hypothesis comes from the Qst-Fst test, which is another way to compare genetic differentiation of a quantitative trait among populations to neutral expectations. Qst measures the proportion of genetic variance in a complex trait (e.g., height, IQ) that exists between populations relative to the total genetic variance and is calculated using the following equation:
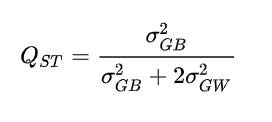
Under neutral scenario, Qst=Fst. However in the presence of divergent selection, Qst>Fst. The variance between populations can be calculated using polygenic scores. The Qst/Fst test is much more powerful than the traditional Fst index for polygenic traits because it takes into account the covariance in allelic effects between populations. Instead, Fst is a measure of genetic distance, hence Fst underestimates the amount of phenotypic differentiation due to additive genetic effects. In fact, Fst is a single-gene test that does not take into account the covariance of allelic effects between populations, which can cause large differences in phenotypic means even with low Fst values.
Kremer and Le Corre (2012) showed that the genetic differentiation at the level of individual loci (Fst) does not necessarily correspond to the genetic differentiation underlying phenotypic traits (Qst). This is because Qst considers the additive genetic variance between populations, while Fst only measures the allele frequency differences.
To distinguish selection from drift, the following steps can be taken:
Generate neutral expectations: Randomly shuffle GWAS effect sizes → create "null" polygenic scores with scrambled phenotype-trait associations.
Compute null Qst: Repeat 1,000+ times to build a neutral Qst distribution.
Compare empirical Qst: Calculate p-value as the proportion of null simulations exceeding observed Qst.
I did this (Piffer, 2023) and the Qst values for EA3 and EA4 deviated significantly from what was expected under the null:

The histogram shows the distribution of random Qst values, and the dotted line the Qst calculated using the actual polygenic scores.
EA4 Polygenic Score Replicates EA3—But With Intriguing Population Differences
The EA4 polygenic score (PGS) (Okbay et al., 2022), the latest iteration of educational attainment genetic predictors, shows a remarkably strong correlation (r > 0.8) with its predecessor, EA3 (Lee et al., 2018), at the population level. This replication is reassuring for the robustness of GWAS findings—but it also comes with some puzzling population-level differences, including very low African PGS and East Asians scoring lower than Europeans despite similar educational outcomes.
EA3 vs. EA4: Strong Correlation, But Population Anomalies
Using two large datasets, one collected from WGS data including gnomAD, 1KG and others, and the other consisting of imputed array data, I plotted EA3 against EA4, confirming the tight relationship.
WGS sample:

Imputed Array+WGS:

The correlation (0.81-0.83) suggests that most of the genetic signal remains stable.
African populations have much lower PGS means—consistent with EA3 but still poorly understood (possible selection effects? Poor tagging of causal variants?).
East Asians score lower than Europeans, despite similar (or higher) real-world educational attainment.
Direct vs. Population Effects: Insights from Within-Family GWAS
A major advance in PGS methodology comes from within-family GWAS (FWGAS), which helps separate direct genetic effects from population stratification and indirect effects (e.g., assortative mating, dynastic effects).
Tan et al. (2024) published a family GWAS estimating direct effects—the genetic impact net of family background. This is crucial because:
Population GWAS effects (from standard GWAS) can be inflated by environmental confounding.
Direct effects (from sibling comparisons) are cleaner but often smaller, as they strip away indirect genetic and environmental influences.
The Challenge: Few SNPs Reach Significance in sibship GWAS
Surprisingly, only one SNP reached genome-wide significance for educational attainment in the Tan et al. study.
This is because sibling GWAS designs inherently have lower statistical power—even at the same sample size—due to reduced genetic variation among siblings. For example:
If both parents are homozygous-reference for a variant, all siblings will inherit the same homozygous-reference genotype, providing no informative contrast.
Even if parents are heterozygous, siblings still have a 25% chance of being genetically identical for that variant (both heterozygous or both homozygous for the same allele), again contributing no usable data.
On top of this inherent power loss, family-based GWAS typically have much smaller sample sizes than population GWAS—further compounding the problem. With fewer informative sibling pairs and fewer total participants, detecting significant effects becomes far more challenging.
This makes constructing a PGS tricky—but we can still leverage the EA3/EA4 SNP set and reweight them using direct-effect betas from the family GWAS. This hybrid approach was validated through an independent simulation study (Zaidi & Mathieson, 2020).
In their analysis, they took lead SNPs identified in a standard GWAS, then re-estimated their effect sizes using an independent sample of 9,000 sibling pairs simulated under the same demographic model. These refined weights were then used to construct polygenic scores in a third, independent sample of 9,000 unrelated individuals.
Even after this adjustment, PGS remained correlated with the environmental effect when it was smoothly distributed—though the association was weaker than when using effect sizes from conventional GWAS. This confirms that while family-based reweighting reduces bias, it doesn’t fully eliminate it under certain conditions.
When I applied this hybrid method to EA, the resulting family-based PGS still correlated highly (r > 0.7) with the standard population GWAS PGS, suggesting that much of the genetic signal persists even after accounting for family effects:
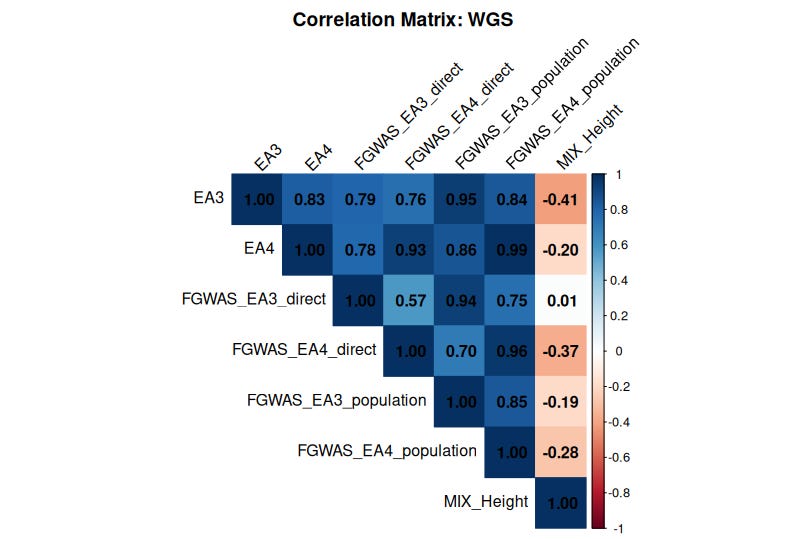

The Curious Case of EA and Height Polygenic Scores
All educational attainment (EA) polygenic scores—EA3, EA4, and the FGWAS EAs—show strong correlations with each other, reinforcing their reliability. But here’s the puzzle: they display a weak yet consistent negative correlation with height PGS.
This finding is difficult to square with the claim (e.g., by Gusev et al.) that polygenic scores lack predictive validity across ancestries. If EA and height PGS were purely noise, we wouldn’t expect any systematic relationship between them—let alone a negative one.
However, it is true that we need better cross-ancestry PGS models and larger family-based GWAS to refine our understanding of nature, nurture, and how genes shape education.
Nails in the Coffin: Ancient Genomes from Graveyards Bury Old Dogmas
Recent analyses of ancient DNA (Piffer, 2025; Piffer & Kirkegaard, 2024c; Akbari et al., 2024) reveal profound shifts in polygenic scores over the past 12,000 years—equivalent to just ~400 human generations. These findings document substantial trait evolution across continents: European height polygenic scores changed by approximately 1 standard deviation since the Neolithic, while educational attainment PGS showed even larger magnitude shifts in both European and East Asian populations. Simultaneously, schizophrenia risk alleles were selected against.
Collectively, these shifts demonstrate rapid recent selection on cognitive and physical traits, implying continental groups likely diverged in trait-relevant alleles during this period. This timescale debunks the Anthro-101 "stasis hypothesis" of minimal human evolution after 50,000 years ago.
The evidence calls for a paradigm shift in anthropological understanding, directly contradicting 20th-century models suggesting cognitive ability peaked with Anatomically Modern Humans (100-50 kya) and underwent minimal subsequent neurological evolution. Instead, ancient genomes support the possibility of population-specific cognitive adaptations and differential trait evolution across regions. This empirical record leaves even the harshest skeptics unable to dismiss the conclusion that human populations evolved distinct genetic trajectories.
As an example, this scatterplot tracks the trajectory of the EA polygenic score over 12 millennia, using genetic data from 3,640 individuals—partially overlapping with Piffer & Kirkegaard (2024c) but expanded with over 1,000 additional genomes:

There is a linear increase amounting to 2 standard deviations up to 1500 years ago, followed by an apparent decline (note that micro-trends could be confounded by ancestry though. I will dedicate another post to this).
Why Low PGS R² Doesn’t Invalidate Between-Population Studies
And the Critical Mistake Most Researchers Make
The common critique—"This PGS only explains 2% of trait variance! How can it say anything about group differences?"—ignores a fundamental distinction in genetic analysis. While low within-group predictive power (R²) does limit individual-level forecasting, it does not invalidate inferences about systematic genetic divergence between populations under selection. Here’s why:
1. Divergent Goals Demand Different Metrics
Within populations, a PGS with R²=0.02 predicts individual outcomes poorly: expected phenotypic differences scale by √R² (e.g., a 1 SD PGS gap implies only ≈0.14 SD in observed traits). This adjustment accounts for noise in shared environments.
Between populations, we seek evidence of systematic genetic divergence, not individual prediction. A +1 SD PGS gap suggests ≈1 SD divergence in total genetic potential—if selection acted proportionally on all causal variants (captured and uncaptured). Low R² adds noise but does not bias the direction or relative ranking of divergence.
2. The Proportionality Assumption: Theory vs. Fallacy
Selection does not exclusively target PGS-captured SNPs—it reshapes frequencies of all causal variants (Piffer 2013; Berg & Coop 2014). Thus:
A population with +1 SD in PGS likely has elevated frequencies of both captured variants and uncaptured causal variants.
The fatal error: Critics assume uncaptured variants did not diverge, demanding group gaps be scaled down by √R² (e.g., 1 SD → 0.14 SD). This artificially dismisses real divergence and contradicts the proportional-selection model.
3. The Height Analogy: Why Partial Measurement Works
Imagine estimating height using only shoulder-to-waist measurements:
For groups: If neck/head proportions are stable, groups with longer torsos will be taller on average. Noise increases but bias is minimal.
For individuals: Predicting one person’s height from torso length fails (low R²).
PGS divergence operates in a similar fashion:Low R²? Like measuring fewer body parts—estimates get noisier but remain unbiased if uncaptured variants diverged proportionally.
Scaling group gaps by √R² assumes selection only shaped PGS-captured SNPs—a biologically implausible claim.
Conclusion: A low-R² PGS is a foggy lens—not a broken one. When selection acts uniformly on the genetic architecture, PGS divergence reflects meaningful differences in total genetic potential.
(For formal theory, see Berg & Coop 2014; for the first applied examples, Piffer 2013.)
Important Limitations and Future Directions
While the evidence presented supports genetic contributions to population differences in complex traits, several critical limitations must be acknowledged:
Educational Attainment Is Not Intelligence
The most significant limitation in this research is the reliance on educational attainment (EA) polygenic scores as proxies for cognitive ability. Educational attainment and intelligence, while correlated, are distinct constructs:
Environmental confounding: Educational outcomes are heavily influenced by socioeconomic factors, cultural values, and institutional access that may not affect cognitive ability directly
Measurement differences: Years of schooling captures persistence, opportunity, and social factors beyond raw cognitive capacity
Cross-cultural validity: Educational systems vary dramatically across populations, making direct comparisons problematic
Absence of Well-Powered Intelligence GWAS
Currently, we lack sufficiently large genome-wide association studies specifically designed to identify genetic variants associated with psychometric intelligence:
Sample size limitations: Existing cognitive ability GWAS are substantially smaller than EA studies, limiting statistical power to detect genetic effects
Measurement standardization: IQ tests, while more direct measures of cognitive ability, have been administered to fewer participants in genetic studies
Population coverage: Most cognitive GWAS have been conducted in European populations, limiting generalizability
Within-Family Studies Remain Underpowered
Family-based GWAS designs, while methodologically superior for isolating direct genetic effects, suffer from critical limitations:
Reduced statistical power: Sibling comparisons inherently provide less genetic variation than population-based studies
Sample size constraints: Current within-family studies include far fewer participants than needed for robust polygenic score construction
Limited trait coverage: Few complex traits have been studied using adequately powered family designs
Multi-Ancestry GWAS Still Lack Diversity
Despite efforts to include diverse populations, most "multi-ancestry" genetic studies remain heavily skewed toward European participants:
European overrepresentation: Even in studies labeled as multi-ancestry, European participants typically comprise >90% of the sample
Linkage disequilibrium patterns: Genetic variants identified in European populations may not tag causal variants effectively in other ancestries
Population-specific effects: Rare variants specific to non-European populations remain largely undetected
Implications for Interpretation
These limitations suggest several important caveats:
Proxy measures: Current findings primarily reflect genetic influences on educational outcomes rather than cognitive ability per se
Methodological refinement needed: Larger within-family studies are essential for distinguishing direct genetic effects from environmental and indirect genetic influences
Cross-ancestry validation: Precise estimates about population differences require adequately powered studies across all major ancestral groups
Causal inference: The relationship between genetic variants, cognitive ability, and educational outcomes remains incompletely understood
Future Research Priorities
To address these limitations, the field requires:
Large-scale cognitive GWAS: Direct measurement of psychometric intelligence in diverse, well-powered samples
Expanded family studies: Within-family designs with sufficient sample sizes to construct reliable polygenic scores
True multi-ancestry research: Genetic studies with balanced representation across global populations
Mechanistic understanding: Research linking genetic variants to biological pathways affecting cognitive development
Only through addressing these fundamental limitations can we develop a more complete understanding of genetic influences on human cognitive traits and their variation across populations.
References
Akbari, A., ..., and D. Reich. (2024). Pervasive findings of directional selection realize the promise of ancient DNA to elucidate human adaptation. Working paper, BioRxiv.
Berg JJ, Coop G (2014). A Population Genetic Signal of Polygenic Adaptation. PLoS Genet 10(8): e1004412. https://doi.org/10.1371/journal.pgen.1004412
Chen, TT., Kim, J., Lam, M. et al. Shared genetic architectures of educational attainment in East Asian and European populations. Nat Hum Behav 8, 562–575 (2024). https://doi.org/10.1038/s41562-023-01781-9
Curtis D. (2018). Polygenic risk score for schizophrenia is more strongly associated with ancestry than with schizophrenia. Psychiatric genetics, 28(5), 85–89. https://doi.org/10.1097/YPG.0000000000000206
Dunkel, C. S., Woodley of Menie, M. A., Pallesen, J., & Kirkegaard, E. O. W. (2019). Polygenic scores mediate the Jewish phenotypic advantage in educational attainment and cognitive ability compared with Catholics and Lutherans. Evolutionary Behavioral Sciences, 13(4), 366–375. https://doi.org/10.1037/ebs0000158
Fuerst, J. & Shibaev, V. & Kirkegaard, E. O. W. (2023). A Genetic Hypothesis for American Race/Ethnic Differences in Mean g: A Reply to Warne (2021) with Fifteen New Empirical Tests Using the ABCD Dataset. Mankind Quarterly, 2023 June
Hou K, Ding Y, Xu Z, Huang L, Wu Y, Zhou JJ (2023). "Causal effects on complex traits are similar for common variants across segments of different continental ancestries within admixed individuals." Nat Genet. 55(4):549–558. doi:10.1038/s41588-023-01338-6.
Howe, L. J., Nivard, M. G., Morris, T. T., Hansen, A. F., Rasheed, H., Cho, Y., Chittoor, G., Ahlskog, R., Lind, P. A., Palviainen, T., van der Zee, M. D., Cheesman, R., Mangino, M., Wang, Y., Li, S., Klaric, L., Ratliff, S. M., Bielak, L. F., Nygaard, M., Giannelis, A., … Davies, N. M. (2022). Within-sibship genome-wide association analyses decrease bias in estimates of direct genetic effects. Nature genetics, 54(5), 581–592. https://doi.org/10.1038/s41588-022-01062-7
Kremer, A., & Le Corre, V. (2012). Decoupling of differentiation between traits and their underlying genes in response to divergent selection. Heredity, 108, 375–385. https://doi.org/10.1038/hdy.2011.81
Lam M, Chen CY, Li Z, Martin AR, Bryois J, Ma X, Gaspar H, Ikeda M, Benyamin B, Brown BC, Liu R, Zhou W, Guan L, Kamatani Y, Kim SW, Kubo M, Kusumawardhani AAAA, Liu CM, Ma H, Periyasamy S, Takahashi A, Xu Z, Yu H, Zhu F; Schizophrenia Working Group of the Psychiatric Genomics Consortium; Indonesia Schizophrenia Consortium; Genetic REsearch on schizophreniA neTwork-China and the Netherlands (GREAT-CN); Chen WJ, Faraone S, Glatt SJ, He L, Hyman SE, Hwu HG, McCarroll SA, Neale BM, Sklar P, Wildenauer DB, Yu X, Zhang D, Mowry BJ, Lee J, Holmans P, Xu S, Sullivan PF, Ripke S, O'Donovan MC, Daly MJ, Qin S, Sham P, Iwata N, Hong KS, Schwab SG, Yue W, Tsuang M, Liu J, Ma X, Kahn RS, Shi Y, Huang H. Comparative genetic architectures of schizophrenia in East Asian and European populations. Nat Genet. 2019 Dec;51(12):1670-1678. doi: 10.1038/s41588-019-0512-x. Epub 2019 Nov 18. PMID: 31740837; PMCID: PMC6885121.
Lasker, J., Pesta, B. J., Fuerst, J. G. R., & Kirkegaard, E. O. W. (2019). Global Ancestry and Cognitive Ability. Psych, 1(1), 431-459. https://doi.org/10.3390/psych1010034
Lee, J. J., Wedow, R., Okbay, A., Kong, E., Maghzian, O., Zacher, M., Nguyen-Viet, T. A., Bowers, P., Sidorenko, J., Karlsson Linnér, R., Fontana, M. A., Kundu, T., Lee, C., Li, H., Li, R., Royer, R., Timshel, P. N., Walters, R. K., Willoughby, E. A., Yengo, L., … Cesarini, D. (2018). Gene discovery and polygenic prediction from a genome-wide association study of educational attainment in 1.1 million individuals. Nature genetics, 50(8), 1112–1121. https://doi.org/10.1038/s41588-018-0147-3
Okbay, A., Wu, Y., Wang, N., Jayashankar, H., Bennett, M., Nehzati, S. M., Sidorenko, J., Kweon, H., Goldman, G., Gjorgjieva, T., Jiang, Y., Hicks, B., Tian, C., Hinds, D. A., Ahlskog, R., Magnusson, P. K. E., Oskarsson, S., Hayward, C., Campbell, A., Porteous, D. J., … Young, A. I. (2022). Polygenic prediction of educational attainment within and between families from genome-wide association analyses in 3 million individuals. Nature genetics, 54(4), 437–449. https://doi.org/10.1038/s41588-022-01016-z
Piffer, D. (2013). Factor Analysis of Population Allele Frequencies as a Simple, Novel Method of Detecting Signals of Recent Polygenic Selection: The Example of Educational Attainment and IQ. Mankind Quarterly, 54(2), 168–200. https://doi.org/10.46469/mq.2013.54.2.3
Piffer, D. (2015). A review of intelligence GWAS hits: Their relationship to country IQ and the issue of spatial autocorrelation. Intelligence, 53, 43–50. https://doi.org/10.1016/j.intell.2015.08.008
Piffer, D. (2019). Evidence for Recent Polygenic Selection on Educational Attainment and Intelligence Inferred from Gwas Hits: A Replication of Previous Findings Using Recent Data. Psych, 1(1), 55-75. https://doi.org/10.3390/psych1010005
Piffer, D. (2021). Divergent selection on height and cognitive ability: evidence from Fst and polygenic scores. OpenPsych. https://doi.org/10.26775/op.2021.04.03
Piffer, D., & Lynn, R. (2022). In Italy, North-South Differences in Student Performance Are Mirrored by Differences in Polygenic Scores for Educational Attainment. Mankind Quarterly, 62(4), 602–616. https://doi.org/10.46469/mq.2022.62.4.2
Piffer, D. (2023). Signals of Human Polygenic Adaptation: Moving Beyond Single-Gene Methods and Controlling for Population-Specific Linkage Disequilibrium. Qeios. doi:10.32388/HDJK5P.2.
Piffer, D., & Kirkegaard, E. O. W. (2024a). Polygenic Selection and Environmental Influence on Adult Body Height: Genetic and Living Standard Contributions Across Diverse Populations. Twin research and human genetics : the official journal of the International Society for Twin Studies, 1–18. Advance online publication. https://doi.org/10.1017/thg.2024.43
Piffer, D., & Kirkegaard, E. O. W. (2024b). Predictive Accuracy of Polygenic Scores from European GWAS among Chinese Provinces. Mankind Quarterly, 65(1), 58–71. https://doi.org/10.46469/mq.2024.65.1.6
Piffer, D. (2025). Directional Selection and Evolution of Polygenic Traits in Eastern Eurasia: Insights from Ancient DNA. Twin Research and Human Genetics, 28, 1-20.
Piffer, D., and E. O. Kirkegaard (2024c). Evolutionary trends of polygenic scores in European populations from the Paleolithic to modern times. Twin Research and Human Genetics, 27, 30-49.
Schwaba, T., Sullivan, M. L. C., Akingbuwa, W. A., Ilves, K., Tanksley, P. T., Williams, C. M., Dragostinov, Y., Liao, W., Ackerman, L. S., Fealy, J. C. M., Hemani, G., de la Fuente, J., Gupta, P., Stein, M. B., Gelernter, J., Levey, D. F., Võsa, U., Ausmees, L., Realo, A., Estonian Biobank Research Team, Vaht, M., Allik, J., Esko, T., Mõttus, R., Vainik, U., Jonsdottir, G. A., Thorleifsson, G., Gunnarsson, Á. F., Bjornsdottir, G., Thorgeirsson, T. E., Stefansson, H., Stefansson, K., Cheesman, R., Qin, Q., Corfield, E. C., Ask, H., Torvik, F. A., Ystrom, E., Tesli, M., Boomsma, D. I., de Geus, E. J. C., Hottenga, J.-J., Melo, D. C., Snieder, H., Hartman, C. A., Xia, C., Campbell, A., Luciano, M., Deary, I. J., Hill, W. D., Jang, S.-K., Vrieze, S. I., Abecasis, G., Lupton, M. K., Mitchell, B. L., Viher, P. V., Colodro-Conde, L., Martin, N. G., Medland, S. E., Derks, E. M., Wormington, B., Kaprio, J., Silventoinen, K., Palviainen, T., Gidziela, A., Rimfeld, K., Plomin, R., Malanchini, M., Dick, D. M., Aliev, F., COGA Collaborators, The Spit for Science Working Group, Wesseldijk, L. W., Ullén, F., Mosing, M. A., Kranzler, H. R., Nunez, Y., Beck, S., Polimanti, R., Edwards, T., Giannelis, A., Willoughby, E. A., Lee, J. J., McGue, M., Terracciano, A., Marongiu, M., Fiorillo, E., Cucca, F., Sutin, A. R., van der Most, P. J., Oldehinkel, A. J., Kretschmer, T., Shabalin, A. A., Docherty, A. R., Krueger, R. F., Freilich, C. D., Mishra, B. H., Lehtimäki, T., Raitakari, O. T., Kähönen, M., Saarinen, A., Dobewall, H., Keltikangas-Järvinen, L., Berger, K., Herrera-Rivero, M., Streit, F., Awasthi, S., Witt, S. H., Tuhkanen, J., Räikkönen, K., Eriksson, J. G., Lahti, J., Davies, G., Redmond, P., Taylor, A., Corley, J., Russ, T. C., Ciullo, M., Nutile, T., Ding, J., Qian, Y., Tanaka, T., Ferrucci, L., Zillich, L., Sirignano, L., Harden, K. P., Genç, E., Gajewski, P. D., Getzmann, S., Fraenz, C., Peñate, J. E. S., Lis, S., Hall, A. S. M., Schmahl, C., Herpertz, S. C., Abdellaoui, A., Nivard, M. G., & Tucker-Drob, E. M. (2025). Robust inference and widespread genetic correlates from a large-scale genetic association study of human personality. bioRxiv. https://doi.org/10.1101/2025.05.16.648988
Tan, T., Jayashankar, H., Guan, J., Nehzati, S. M., Mir, M., Bennett, M., Agerbo, E., Ahlskog, R., Andrade Anapaz, V. P. de, Åsvold, B. O., Benonisdottir, S., Bhatta, L., Boomsma, D. I., Brumpton, B., Campbell, A., Chabris, C. F., Cheesman, R., Chen, Z., China Kadoorie Biobank Collaborative Group, ... Young, A. S. (2024). Family-GWAS reveals effects of environment and mating on genetic associations. medRxiv. https://doi.org/10.1101/2024.10.01.24314703
Yengo L, Vedantam S, Marouli E, Sidorenko J, Bartell E, Sakaue S, et al. (2022). "A saturated map of common genetic variants associated with human height." Nature. 610(7933):704–712. doi:10.1038/s41586-022-05275-y.
Zaidi, A. A., & Mathieson, I. (2020). Demographic history mediates the effect of stratification on polygenic scores. eLife, 9, e61548. https://doi.org/10.7554/eLife.61548
Zhang, J., Zhang, S., Qiao, J. et al. Similarity and diversity of genetic architecture for complex traits between East Asian and European populations. BMC Genomics 24, 314 (2023). https://doi.org/10.1186/s12864-023-09434-x
The "peer reviewed" complaint is rich considering he regularly posts findings (that often contradict the published literature) to his personal twitter (e.g. failing to replicate the Withspoon 2007 finding of same-race people ~always being more genetically similar than different-race people) without bothering to put them in papers.
"Surprisingly, only one SNP reached genome-wide significance for educational attainment in the Tan et al. study"..."but we can still leverage the Ea3/Ea4 SNP set and reweight them using the direct-effect betas from the family GWAS"
Why stop with the SNPs marked as significant in the between-family GWAS? Why not just use the complete set of SNPs that people vary on? It's not just adding significant SNPs which adds signal to a PGS, it's also reducing the error with which differences in effects between significant SNPs are estimated, which happens with every increase in statistical power. Likewise, in any set of 1000 SNPs which contains no individually-significant SNPs, it should still be possible to say that at least some have trait effects even if you can't say which. With EA4 for example, in the Add health validation sample, 9.1% of variance can be explained using only significant hits, but with a PGS using variants which aren't individually-significant, R^2 rises to 15.8% (see p.440):
https://not-equal.org/content/pdf/misc/10.1038.s41588-022-01016-z.pdf
If the situation with FGWAS is similar, applying the hybrid approach only to significant EA4 hits would capture only 9.1/15.8 = 57.6% of reliable signal in the FGWAS PGI. It's this principle which even makes the hybrid approach valid to begin with. I wouldn't be surprised if there were the power to do proper polygenic selection analysis, dividing SNPs into MAF+LD bins and then generating control PGIs by redistributing the effect sizes among SNPs sharing a common bin.